I set out on my spring break trip in the beautiful morning over Central Park, where I checked the app on my iPhone to locate the nearest docking station of Citi Bike, New York’s new bike sharing system. I wanted to circle around this iconic, wonderful park in the heart of Manhattan, which is listed by Tripadvisor as the number 1 thing to do in the city. As a tourist holding a 24-hour access pass, I had 30 minutes to explore the park on a bicycle before being charged a fee. I had taken 24 minutes to enjoy the breathtaking views from the flat and hilly scenic terrain of the park and returned the bike back to the same docking station.
My trip later in the evening went badly. After capturing remarkable attractions with my Canon 600D in Times Square, I found a station in the intersection of Broadway and W 41 St. Intending to pedal to my 6 p.m. dinner, I couldn’t find any bikes attached to the docking station. I realized that it was rush hour, the time for people go home from work. While I was wondering whether many people used the bikes for commuting to and from work, resulting in empty stations, a truck with a large “Citi Bike” logo written on its container arrived 15 minutes later. The driver got out of the truck and opened up the container’s door, lifting the blue bikes out and placing them into the chunky gunmetal gray slots that rose up from the sidewalk. Though still amazed, I inserted my little rectangular plastic “key” and pulled one bike from the pedal and headed to my dinner.
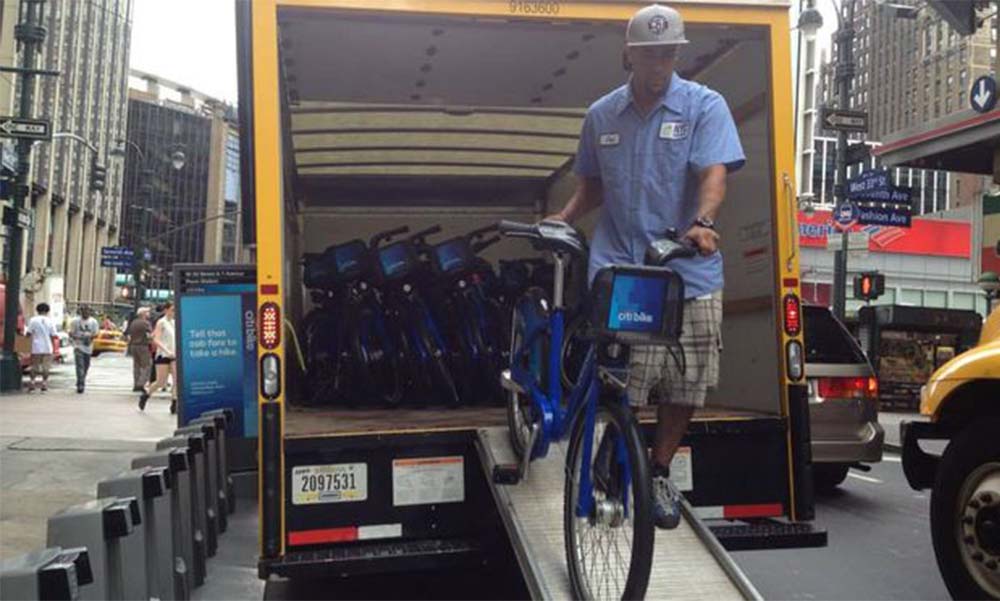 Citi Bike staff filling empty docks by the bicycle truck.
Citi Bike as well as other bike sharing programs have the potential to revolutionize city life, not just in New York. While New York has the nation’s largest program with more than 6,000 bikes and 300 docking stations, the Capital Bikeshare system in DC has been running for almost 5 years. What makes the programs special and potentially game-changing is that we only possess the bicycle while we are riding it. We pick it up, use it and leave it. If I bike to work using my own bicycle, I have to worry about locking it up and riding it back to my home again, even if the weather has changed, or simply if my mood to ride my bike has changed.
The bikes save time when traveling while expanding the number of places in a city that we can reach quickly and easily. They are a type of public transit that provides the same mobility as personal private transport without the costs or burdens. They also increase the flexibility of the transportation system. With bicycles eventually distributed all around the city, I could see a rich combination of bikes, taxis, cabs, subways, buses, and private cars in our daily lives. However, as the system grows, problems like what I faced in Times Square occurred: empty docks. The map below shows a lot of stations with empty docks in NYC, without any available bikes that riders can use. But the docks cannot be fully occupied also, since riders will need empty docks to drop off their bikes.
Stations with empty docks in NYC (data at 8:00:04pm, 14 May 2015).Full bike docks can be an even bigger problem. If the dock is empty, I can just go and get the subway or a bus. When it is full, and I am on a bike, I have to cycle around with the meter running and find a nearby bike station that is not full. Thus, the bikeshare company has to maintain the balance between available bikes and empty docks across the city in order to optimize the system. It would be beneficial to plan the system if the company understood which stations are often used by commuters and which are used by leisure riders, like what I did in Central Park. However, distinguishing between the types of stations is not easy, since the riders are not asked to let the system know. So, can we classify affordances of bikeshare stations into commuters and leisure riders?
Data
In order to answer this question, my collaborator and I used trip history data provided by Citi Bike (NYC) and Capital Bikeshare (DC) to look for interesting footprints in the data. Citi Bike and Capital Bikeshare provide cleaned datasets to the public through their websites:
Capital Bikeshare gives more than 300 stations’ information in DC, including the latitude and longitude coordinates in XML format, whereas Citi Bike also provides more than 300 stations’ information in NYC in JSON format. Both bike sharing systems provide detailed trip history data in CSV format (quarter based for Capital and monthly based for Citi), including trip duration, start/end station, user type, bike ID, and timestamp. However, unlike Citi Bike, Capital Bikeshare doesn’t provide a rider’s profile that indicates gender and age, so taking a rider’s profile into our analyses will not be possible. Compared to the Capital Bikeshare data (the company has been running the system since 2010), Citi Bike just started in July 2013. In order to make comparisons fairly, we use the Capital Bikeshare's 2011 data and Citi Bike's 2014 data after allowing for a couple quarters of “start up lag” in the system and business. According to data, there are more than 1.2 million trips generated in 2011 for DC and 8 million trips in 2014 for NYC.
We then cut the dataset into round trips and one-way trips. According to an analysis in Chicago’s bike challenge, round trips represent riders that bike for leisure, exercise and other social activities, cycle from and to the same point A, while one-way trips show people riding with intent, getting from point B to point C or vice versa. Where are they located in the city? Can we predict a station’s affordance from its location? Learning the round trip and one-way trip stations’ location will be useful to see if the surroundings attract different riders to use bike for fun or for commuting.
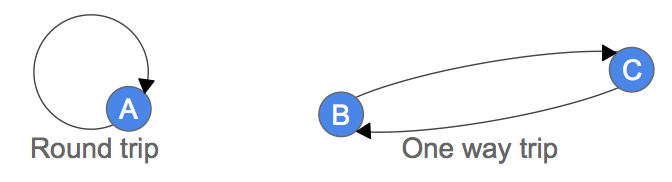 Round trip: bike for leisure, one way trip: riding with intent.
Most Frequent Trips
That being said, we can see stations in NYC’s most frequent trips below consist of round trips, one-way trips, and stations that are a combination of both of them. As can be seen from the map, round trip stations are found in Lower Manhattan, Rockefeller Park and New York City Hall. This may indicate that leisure riders enjoy the greenways and scenic views by riding along the Hudson River and West Channel close to Brooklyn Bridge. Round trip stations are also found in Central Park. Although stations in Central Park contain both trips, they are actually going to different stations still in Central Park. Similar to stations in Lower Manhattan, beautiful views offered by Central Park attract leisure riders to cycle around the park, just for fun or exercise.
In the other hand, stations with one-way trips are found in the Midtown, the largest central business district in the US where highest employment density is found. Some of the city’s most iconic buildings are in this area, including the Empire State building, the Chrysler building, the United Nations Headquarters, and world famous commercial zones such as Rockefeller Center, Broadway and Times Square. No wonder I was having trouble finding a bike here, as the area is home to the most popular bikeshare station in the city. Workplaces in this business district attract workers coming from all around the city, using bikes as a “last mile” transit from the subway stations they took or bus stops they arrived at. As can be seen from the population density graph, the one-way stations have relatively less dense populations compared to other regions.
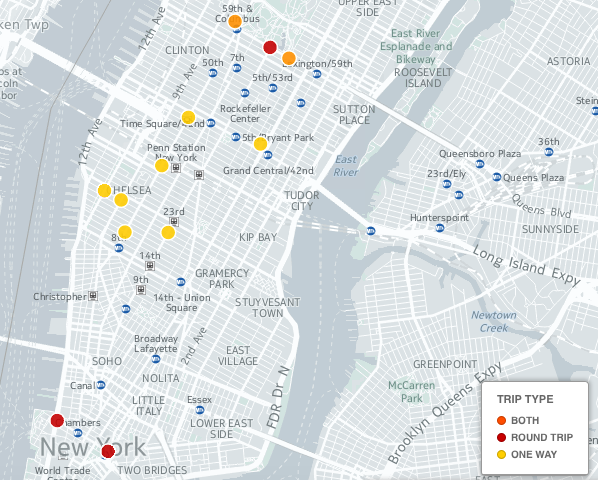 Stations with the most frequent trips in NYC.
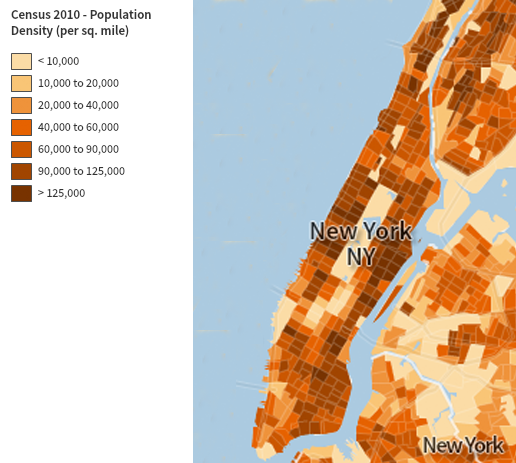 Population density in NYC (source: Census Tract).
Same goes for the stations in DC below that consist of round trips, one-way trips, and both of them. As can be seen from the map, round trip stations are found in the Smithsonian grounds. Similar to NYC, leisure riders are found in the parks, where people can enjoy the iconic Washington Monument, White House, remarkable Smithsonian Castle, and Lincoln Memorial while cycling around the area to exercise. The city’s major attractions and breathtaking view on the Potomac River and Washington Channel again invite leisure riders to pedal their bicycles.
Dupont Circle attracts both one-way and roundtrips as it contains two landmarks: a park and a transit hub, where commuters from Dupont Circle Metro Station transfer in and out from bus stops.
Compared to NYC, DC’s one-way trips vary by location throughout the city, one of which being the Logan Circle area (two yellow circles beside the orange Dupont Circle) that is known as the city’s densest region. One-way trips are found in the dense area of the city, as can be seen in the regions with red scale below that have more than 26,000 people per square mile. The stations with one-way trips are also found in the city’s major metro stations, such as Union Station and East Capitol Transit Terminal (transit central in Lincoln Park) as well as in commercial regions such as Eastern Market and Hechinger Mall.
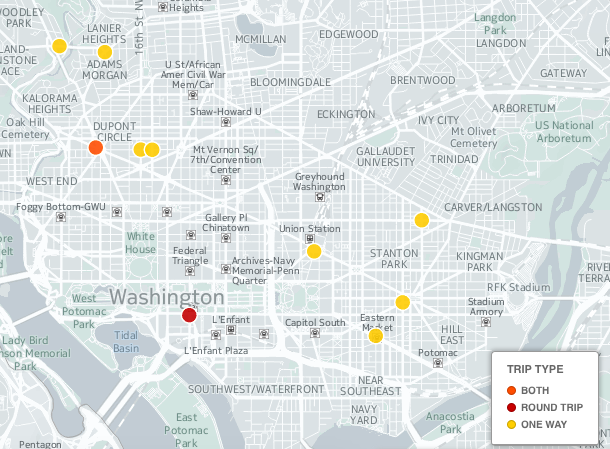 Stations with the most frequent trips in DC.
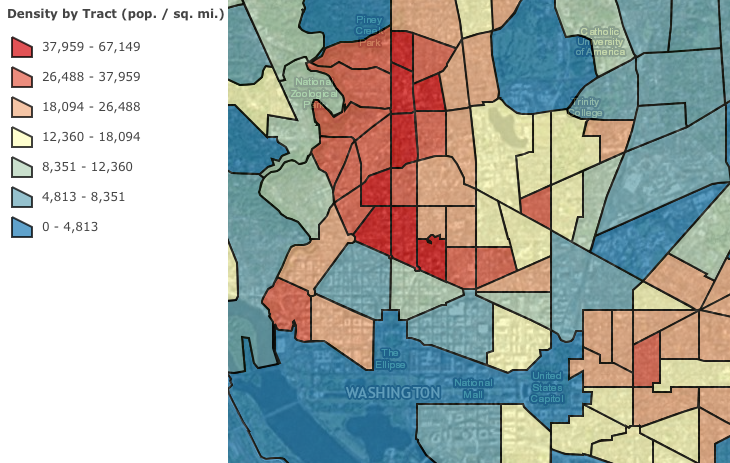 Population density in DC (source: Census Tract).
We now understand that one-way trips and roundtrips depend on station’s location, whether it is surrounded by parks, commercial buildings, tourist attractions, or whether it is located in a highly dense region and close to a metro station. Additionally, bikeshare stations attract different types of riders: commuters and leisure riders. With this knowledge, can we classify the stations based on trip duration? Riders may use bikes for longer or shorter periods of time depending on their purpose. If the distribution of trip durations between one-way and roundtrip is different, we can use trip duration to build a model for predicting station affordances.
Distribution of Trip Duration
Thus, we counted the trip duration for both one way and round trips in NYC and DC and then plotted them as histograms below. We hoped to see the difference in the distribution between one way and round trips, but as we can see, the results are almost similar for all the plots, contrary to our expectations. The distribution’s peak is in the middle, less than 1,000 seconds or 15 minutes, and tends to decrease with longer trips. Most of the riders use bikes for less than 30 minutes, which is reasonable since both Citi Bike and Capital Bikeshare will only charge an additional “overtime” fee for the longer bike trips. From the plots, we can conclude that trip duration cannot be used to classify stations based on the rider types.
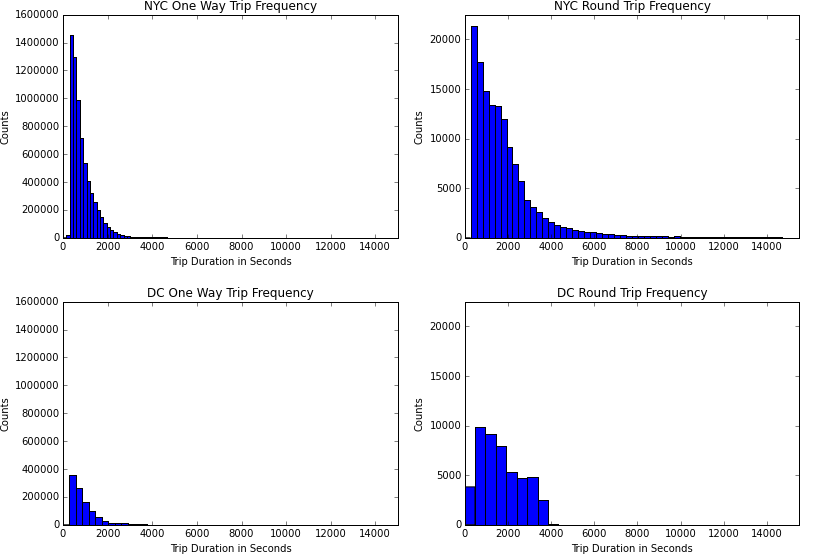 Distribution of trip duration for one way trips and round trips in NYC and DC.
Daily Ridership Pattern
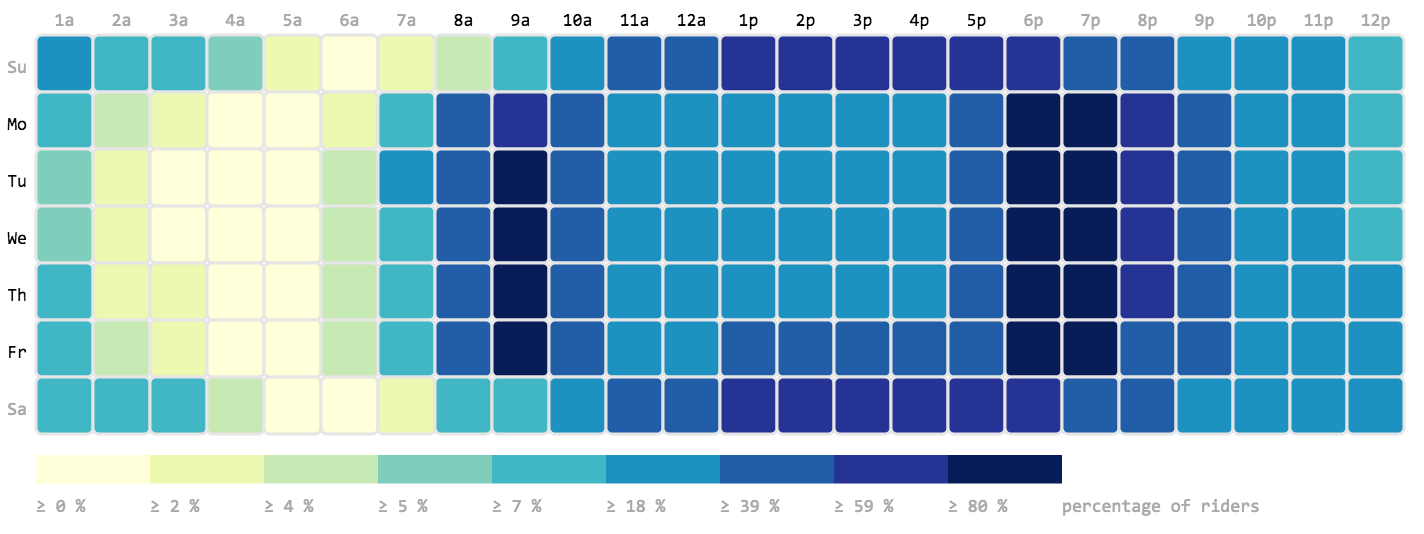
Instead, could we classify the stations based on daily ridership patterns? We hoped to see the difference in daily ridership between one way and round trips, since people who commute to work have to follow the working schedule which is typically 9am to 5pm. If this is different, we can build a model based on daily ridership to predict station affordances. We plotted a heatmap that shows daily ridership pattern for one way trip in NYC and DC as below.
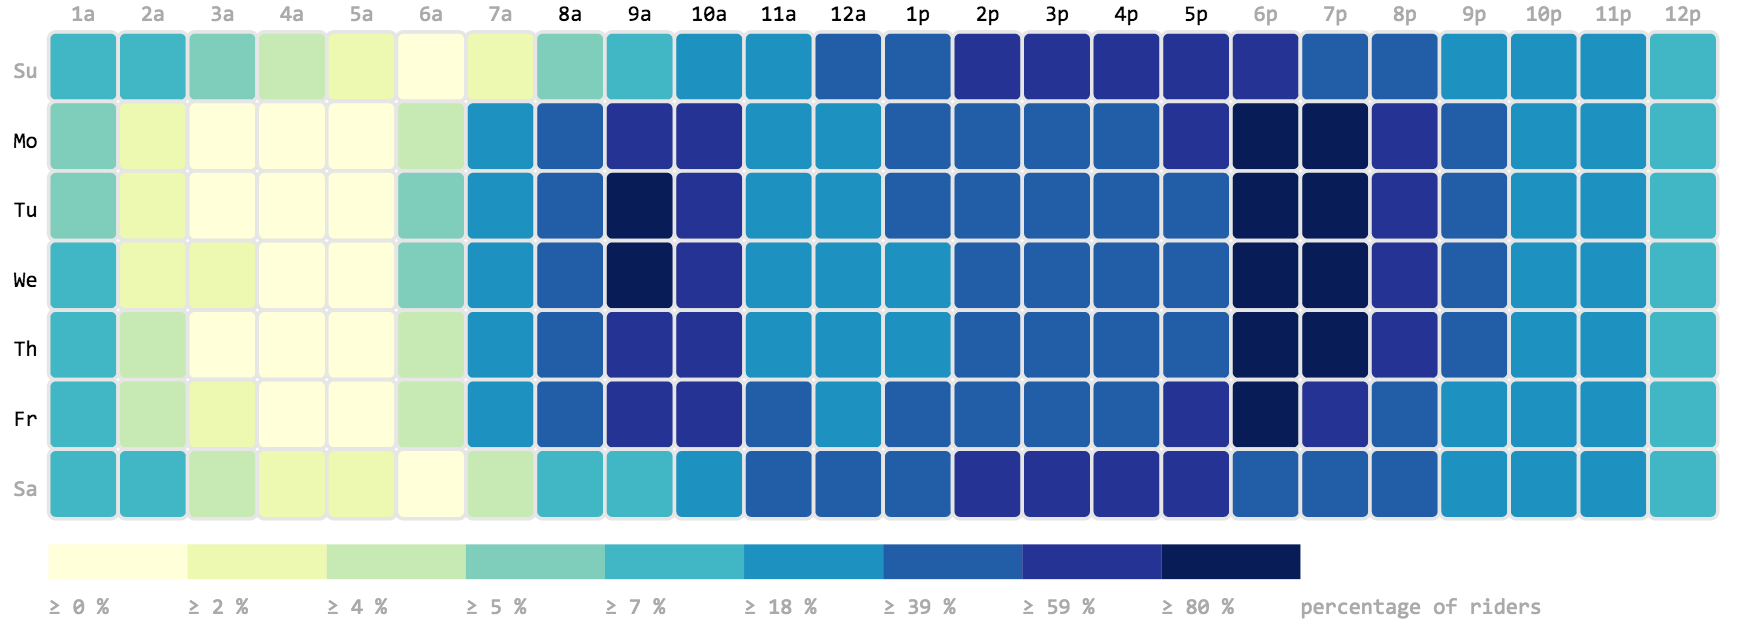 Daily ridership in NYC one way trip.
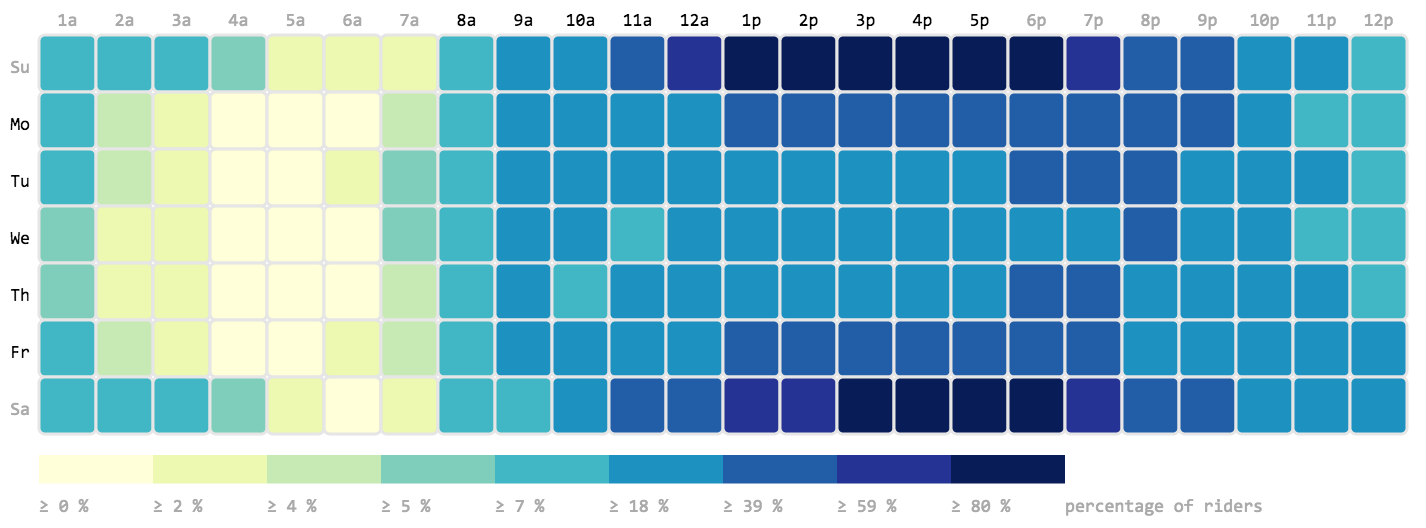
 Daily ridership in DC one way.
We can see that there is a spike of bike usage in above daily ridership centered around 9am and 6-7pm. As expected, this proves that one-way trips mostly contain riders that commute to work, since more than 60% of the riders are found during rush hour traffic times in NYC and more than 40% of the riders in DC. This is interesting because if the pattern for round trip is different, we can predict station affordances based on daily ridership. Let’s see the result when we plot daily ridership for round trips in NYC and DC below.
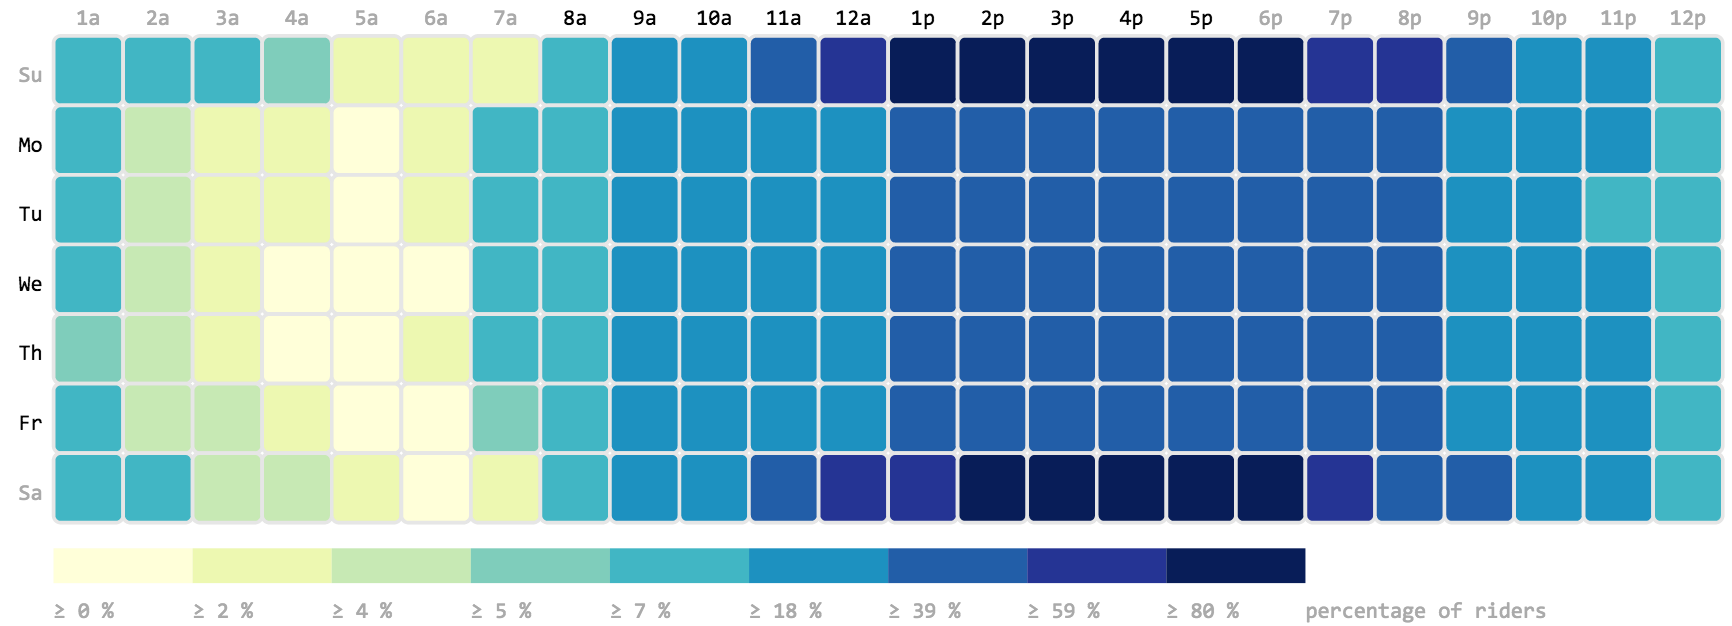 Daily ridership in NYC round trip.
 Daily ridership in DC round trip.
The above daily ridership graphs shows visibly different patterns from one way trips that are centered around rush hour times. Here, there is no discernable difference in weekday patterns over time, but there are heavy spikes over the weekends, showing riders are using bikes during their free time, most likely for fun or exercise. We can conclude that the round trip stations do not attract commuters, but invite leisure riders instead due to their strategic location, e.g. parks, as mentioned in the previous city maps.
Discussion
The graphs tell us bikeshare stations in NYC and DC consist of different trip patterns, one way and round trip, that impact ridership. However, several limitations exist in these findings.
First, actual paths of bike riding are not provided in the dataset. By knowing the paths, we will be able to clearly identify where the riders go to from certain stations. For example, the paths can give us information about the routes that are popular for biking in Central Park or cycling on the Hudson River as well as commuting routes for riders who bike to work. Knowing this will be helpful for identifying why people depart to and arrive from the stations. Thus, we have no choice but to rely on the attractions surrounding the bike stations to deduce where people would hypothetically take bikes.
Second, data on riders is also not provided, such as a rider’s ID, to help make a more detailed analysis that predicts things about the riders themselves, not station affordances. However, getting this kind of data might get us caught in ethical concerns, as dealing with information about specific people can give rise to privacy issues.
Finally, we currently do not have quantifiable data for population density, socioeconomic status, job employment density on each region in NYC and DC, as well as building data, including number of city attractions, shops, and restaurants in certain regions. This data would enable us to do more quantitative analyses for each station and build a more robust model to predict station affordances given several aspects that might impact type of ridership.
Conclusion
Clearly, the two types of bike trips, oneway and roundtrip in DC and NYC, can be distinguished based on the daily ridership pattern but not with trip duration distribution. From the rush hour pattern, we can argue that commuters are found in stations that predominantly include one way trips, whereas riders with round trip behavior use bikes for leisure. Furthermore, several aspects also impact whether stations are often used by commuters or leisure riders, such as location to commercial buildings, parks and population density. For future research, knowing all of these factors will be beneficial in building a model that takes all of the aspects into account in predicting a station’s usage by commuters or leisure riders.
Credits
This project was created by Giri Kuncoro and Samuel Tung for a course in Computational Method for Data Science at Cornell taught by Dan Cosley. Several open-source projects were used including D3, Bootstrap, CartoDB, Matplotlib, and Numpy. Data courtesy of Citi Bike and Capital Bikeshare.
Some of the previous works inspired this project, including Bikeshare Map, Maximizing Bicycle Sharing, Divvy Trip Trends, Divvy Data Challenge, and Bikeshare Station-Level Forecasting.
Source Code
The source code is available on Notebook viewer and raw data is available on github as well as Citi Bike and Capital Bikeshare website.
For any questions, please reach out to Giri Kuncoro or Samuel Tung on Twitter.